New Analytics Page For Events
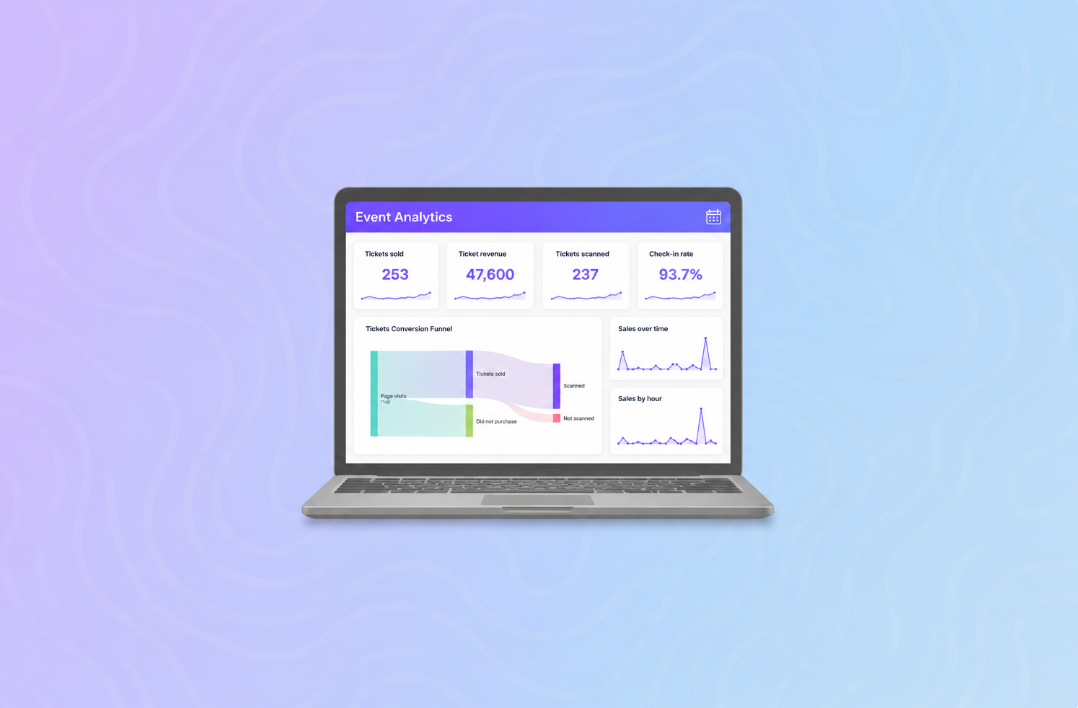
Understanding how your event is performing just got a whole lot easier.
We’ve introduced a new Event Analytics dashboard, giving you a detailed view of sales, attendance, page traffic, and purchasing behavior for each individual event all in one place.
Instead of piecing together event data from different areas, you can now quickly see how your event performed from the first page visit through to ticket purchase and check-in.
Open Analytics from your event. Go to Event Management, open an event, and select Analytics from the sidebar.
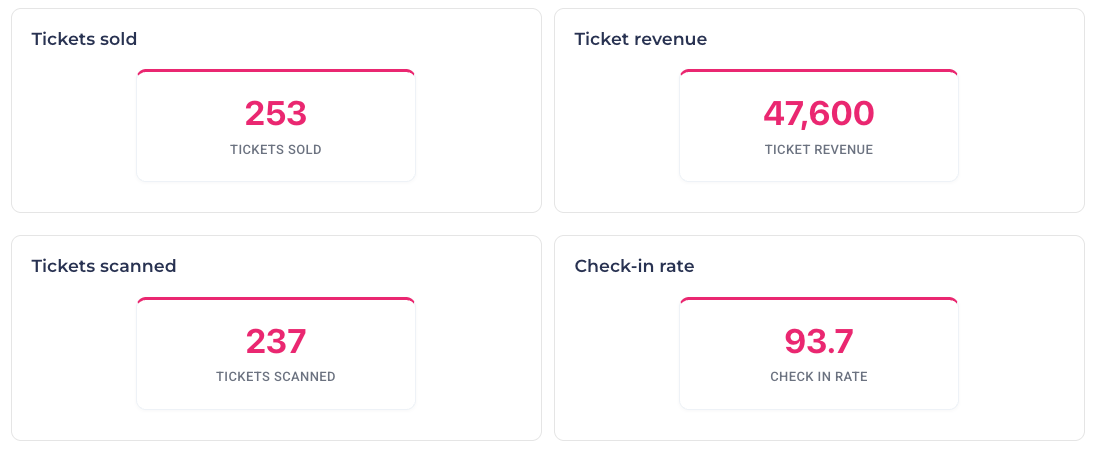
See your key event numbers at a glance. The dashboard starts with the most important event metrics, including:
Tickets sold
Ticket revenue
Tickets scanned
Check-in rate
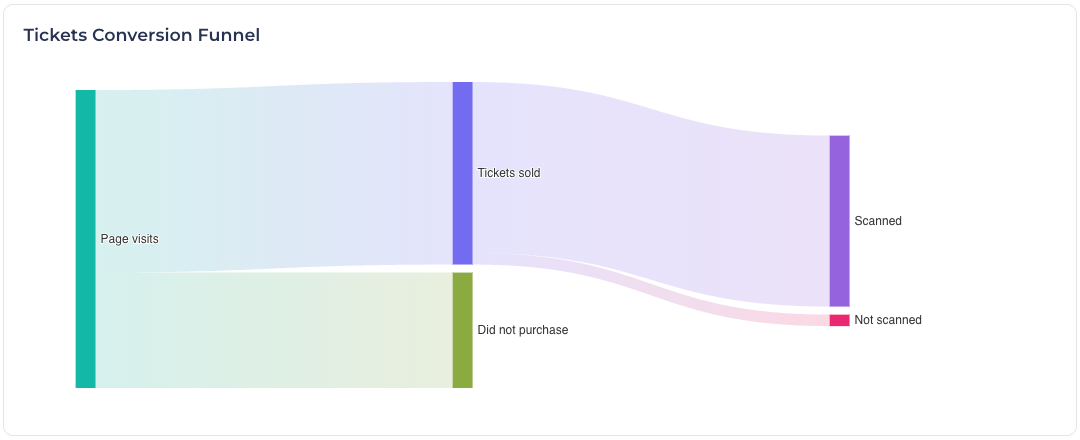
See the full ticket conversion funnel. Follow the journey from page visits → tickets sold → scanned tickets, while also seeing visitors who didn't purchase and sold tickets that haven't been scanned.
This makes it easier to understand how effectively visits to your event page are turning into actual attendance.
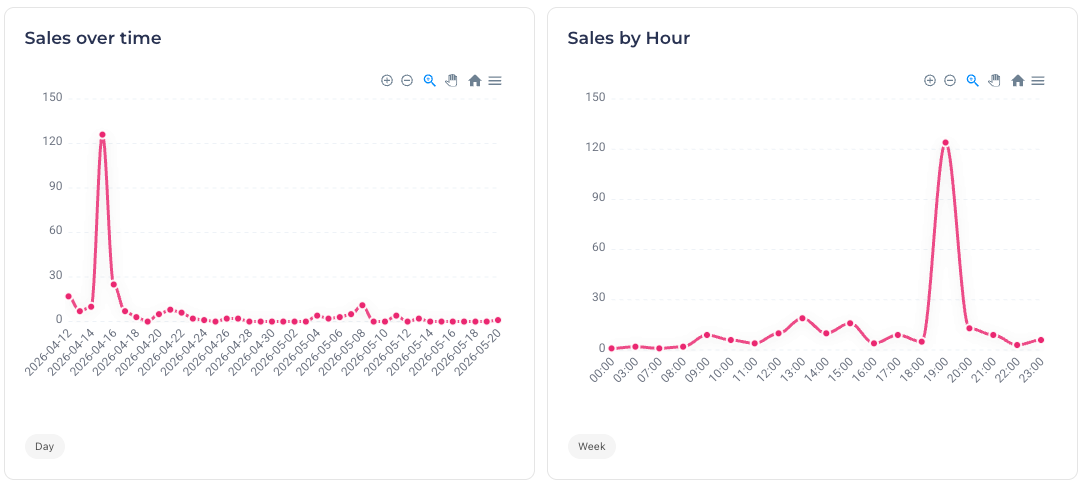
See when your tickets are selling. Sales charts show ticket activity over time and by hour, helping you identify when demand was highest and how sales changed in the lead-up to your event.
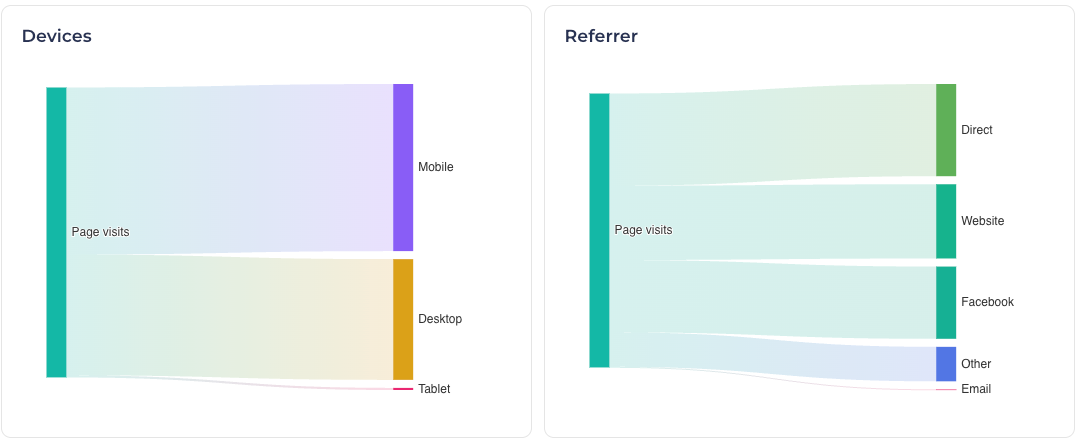
Understand where visitors are coming from and which devices they user. The Referrer breakdown shows how people reached your event page, including direct traffic, websites, Facebook, email and other sources.The Devices breakdown shows page visits across mobile, desktop and tablet.
Break down sales by ticket type. See how many tickets were sold and scanned for each ticket type, making it easy to compare sales and attendance across your different ticket options.
Use cases
After an event. Quickly review ticket sales, revenue, attendance and check-in rate without pulling together separate reports.
Understanding conversion. See how many event page visits turned into ticket sales and how many purchased tickets ultimately resulted in check-ins.
Planning your next event. Use sales-over-time and sales-by-hour data to understand when people are most likely to buy tickets.
Understanding your audience. See which devices people use and where your event traffic is coming from to help inform future promotion.
Comparing ticket types. Quickly see which ticket types sold the most and how many attendees from each ticket type checked in.
Event Analytics is live now! Head over to any event select Analytics to explore your event’s performance.